obx sandbar living monthly market update
Hello, February!
We hope you’re finding ways to stay cozy and make the most of these long winter days while we wait for the first signs of spring to arrive.
Here on the Outer Banks, we enjoyed (or survived, depending on whom you ask!) SNOBX 2026 a few weeks back! It was beautiful while it lasted and gave us a quiet stretch of “snowhere” to be… but we’re definitely ready to turn the page and watch the spring market begin to bloom.
Several new listings have already hit the market, and more are on the way. If you (or someone you know) are thinking about making a move, keep an eye on our listings page so you can be among the first to see what’s new.
As always, if you have questions about a property, a neighborhood, or what the market might mean for your plans, we’re happy to help. Just reach out anytime, and remember, come snow or sunshine, there’s no better living than sandbar living!
Warmly,
Danielle
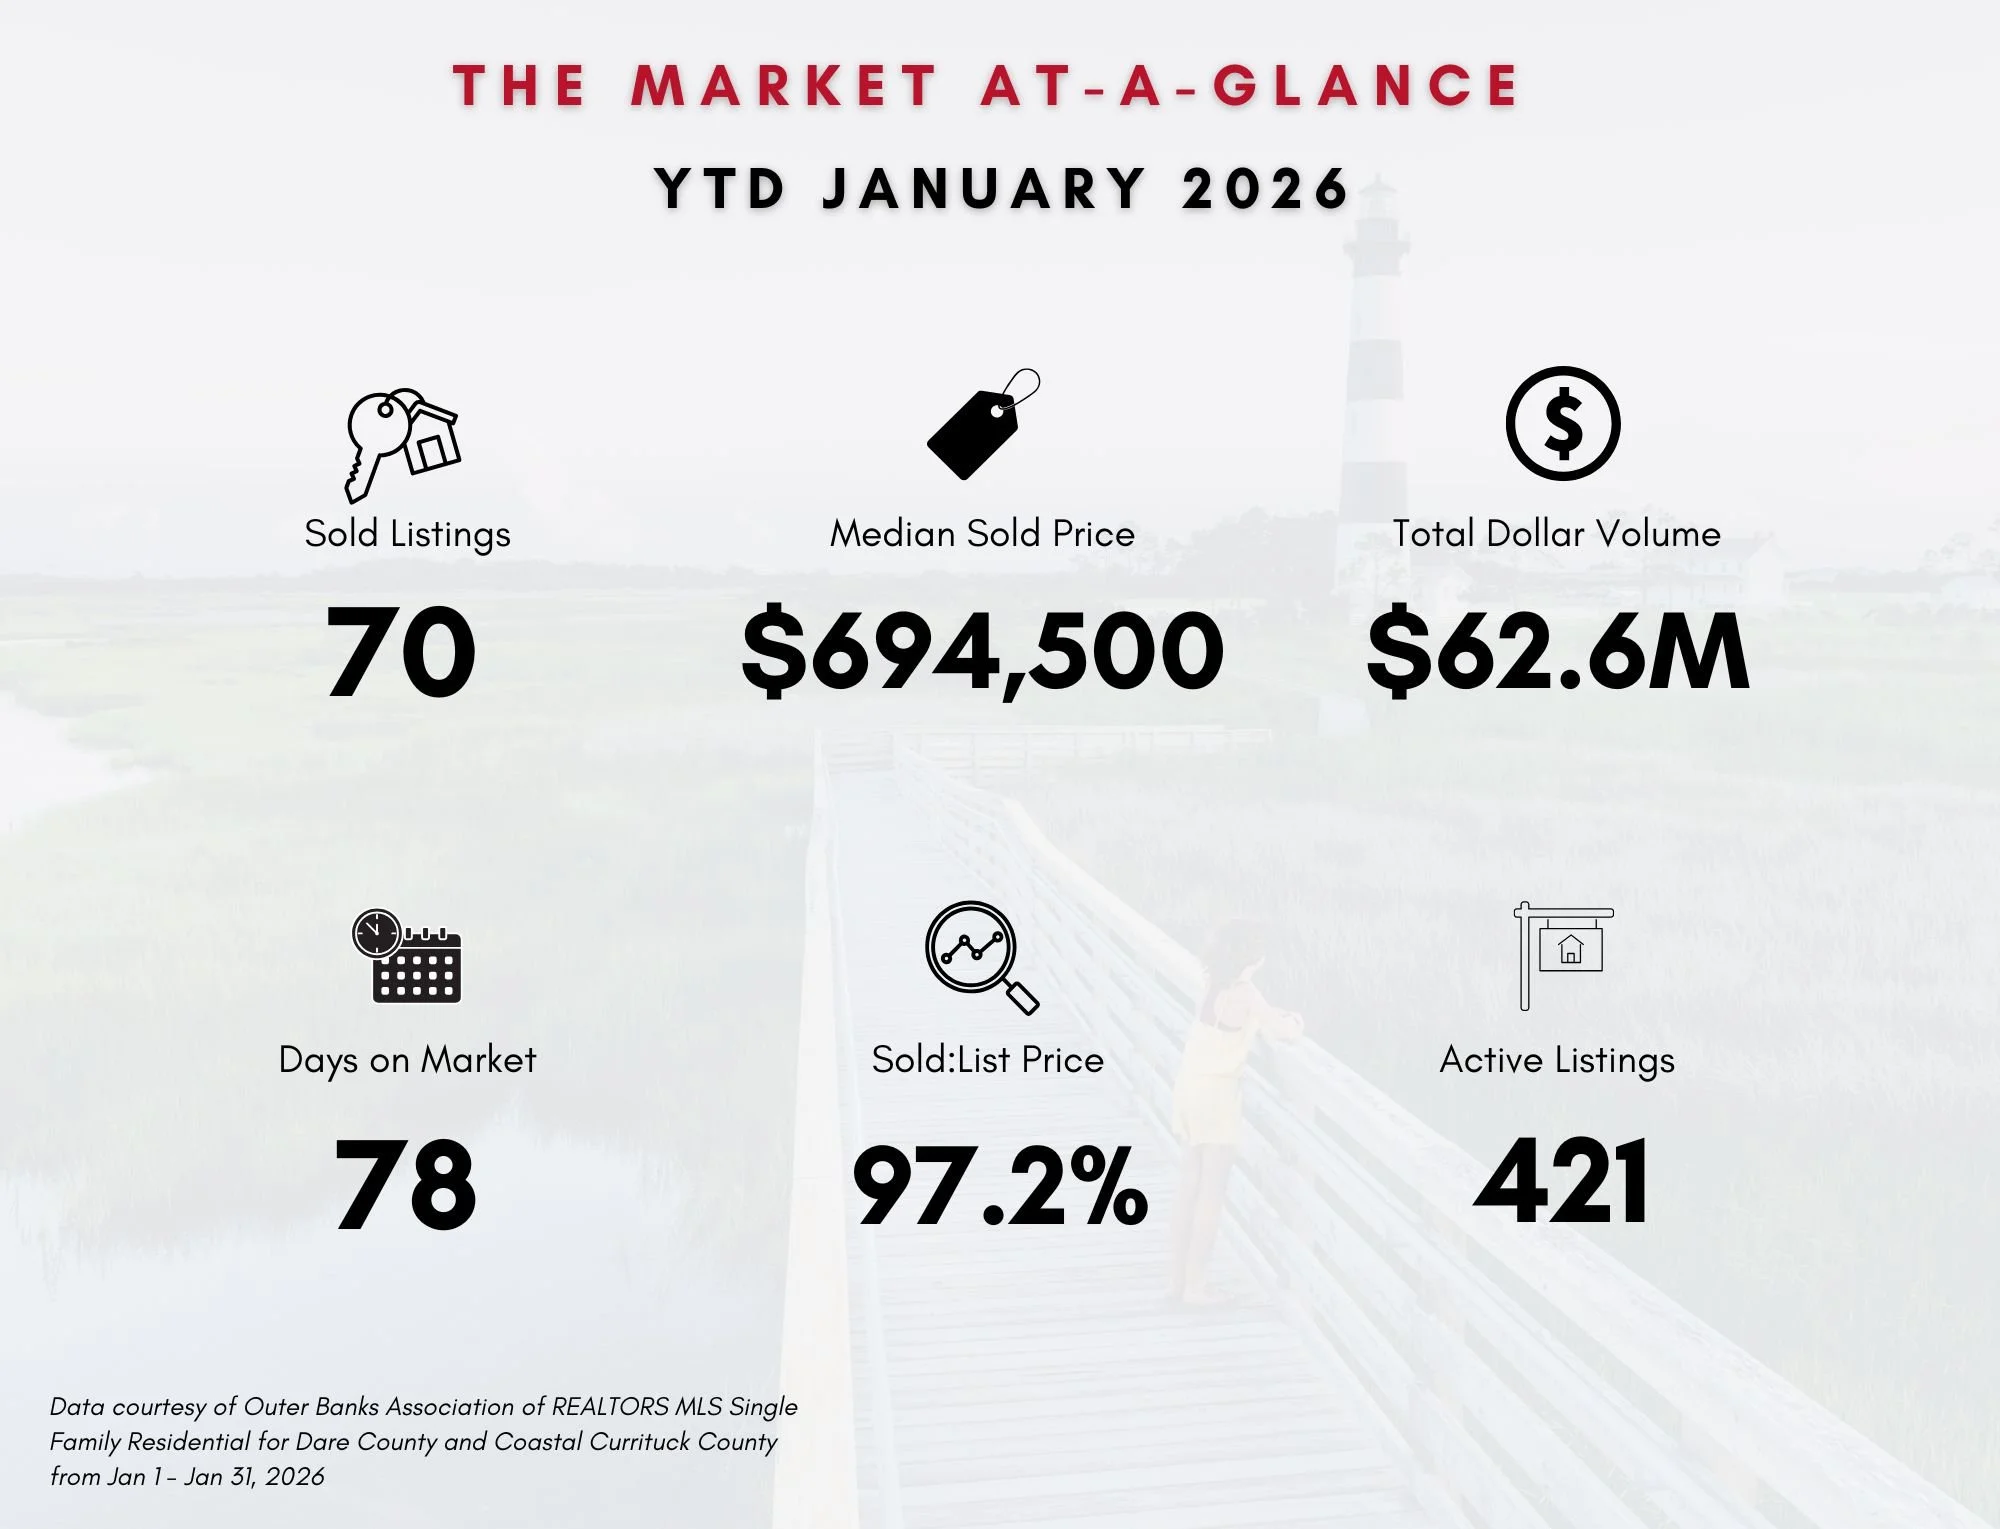
Sold and Under Contract Analysis
SINGLE FAMILY RESIDENTIAL:
YTD residential sales units are down 12.5% versus YTD 2025
YTD residential sales dollars are down 1.5% vs. YTD 2025
YTD median sale price was $694,500, down 1% vs. YTD 2025
Sales units January ‘26 over December ‘25 were down 37%
New listing inventory for January was up 110% versus December
As a comparison, new listings for January ‘26 were down 6.3% versus January ‘25
January residential sales volume was down 38.4% vs. December 2025
While January’s new listings were way up versus the month prior (up 110% versus December 2025!), they’re actually down about 6.3% versus January of last year.
Let's look at month-over-month:
Median sale price for all Residential property sold in January was $694,500--up 9.4% versus December ‘25.
January 2026's median sale price was down 1% versus January 2025.
January ‘26 vs. January ‘25, residential properties sold 16.4% slower, and at a 1% lower median sold price. Many of our major feeder markets experienced prolonged and severe wintry weather in January, along with a surge in new inventory compared to the month prior. Now that we’re experiencing a bit of a thaw weatherwise, we’ve seen buyer interest reactivate going into the spring season. As always, we will keep you posted as to how the data reacts as the season progresses.
RESIDENTIAL LOTS AND LAND:
YTD residential land sales units are down 4% versus YTD 2025.
YTD residential land sales dollars are down 14% versus YTD 2025.
YTD residential land median sold price is $168,000, down 13% versus YTD 2025.
January residential land sales units were up 64% versus December 2025.
January residential land sales dollars were up 51% versus December ‘25.
inventory analysis
New listing inventory for January 2026 was down 6.3% versus January 2025, and up 110% versus December’s new listings.
Drilling down, 149 new residential listings hit the market in January 2026, with 20% of those properties already sold or under contract.
Average days on market for these is 8; median days on market is 6 (the new, good inventory is still moving fast!).
As of February 15, 2026, only 1 of those properties has closed — it was a cash sale and multiple offers were not disclosed (multiple offers are not a required disclosure in our MLS).
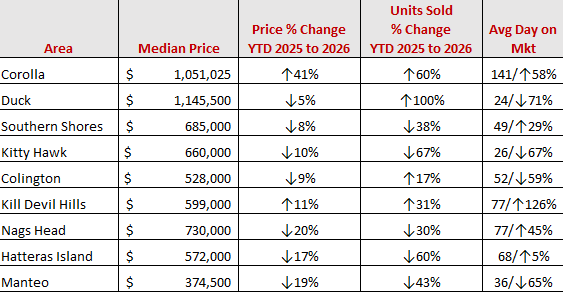
See the chart below for the full breakdown by area…
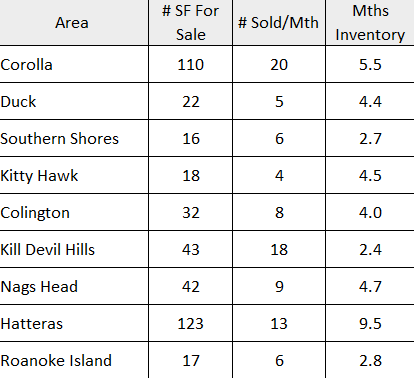
Inventory Analysis by Area YTD 2026
If you’d like to get more hyper-local with your neighborhood or area, please feel free to contact me!
days on market and distressed data analysis
Average days on market for SOLD residential properties in January was 78, flat to December’s average of 78 days.
The average home sold 16.4% slower in January 2026 (78 days) versus January 2025 (67 days).
The Median days on market in January was 50, meaning that half of the sold units did so in 50 days or less.
Average days on market for all current ACTIVE residential listings is 111 days (down 1.8% versus 113 days in December).
Month-over-month, the average days on market for Under Contract properties is 78 days (down 1.7% from 77 days in December ‘25).
20% of properties listed in January have already gone under contract or sold with an average days on market of 8.
It still rings true that homes that are priced consistent with their condition and/or are located in high demand areas per the chart above are still moving quickly and, in some cases, with multiple offers.
There was 1 distressed residential listings sold in January 2026 (up from 0 in December 2025 and 0 in January 2025).
There were 0 distressed active residential listings as of January 31, 2026; down from 2 in December 2025 and 1 in January 2025.
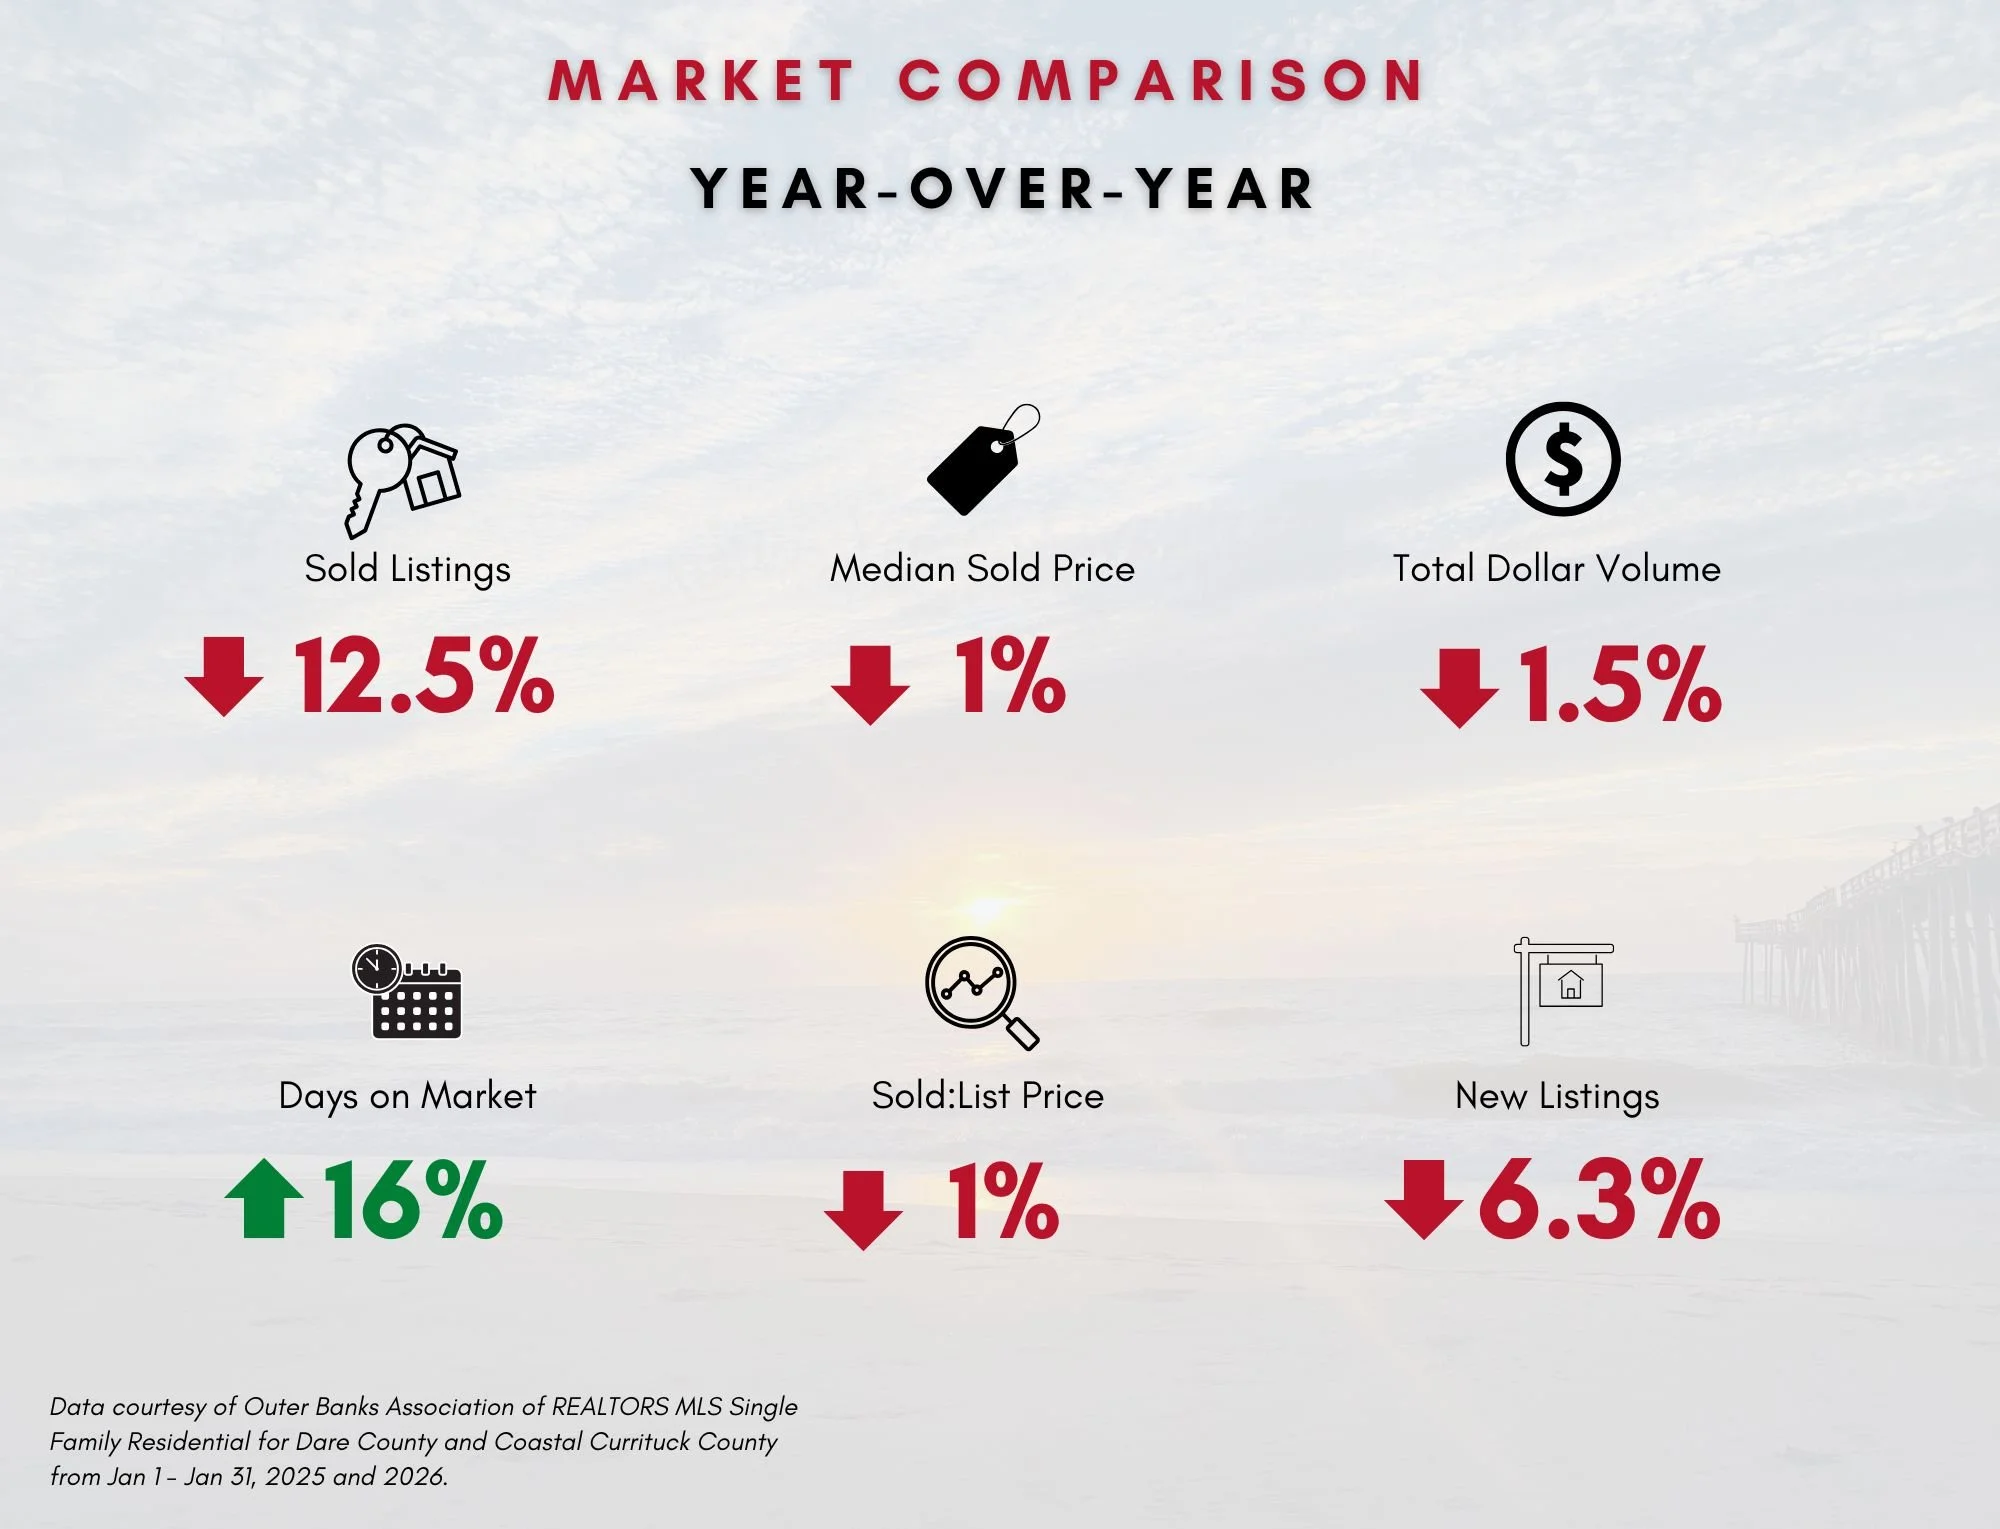
Year-Over-Year Market Comparison
pricing analysis
Residential Median Sale Price for YTD 2026 is $694,500, down 1% versus the year prior.
You’ll find a breakdown by price point below:
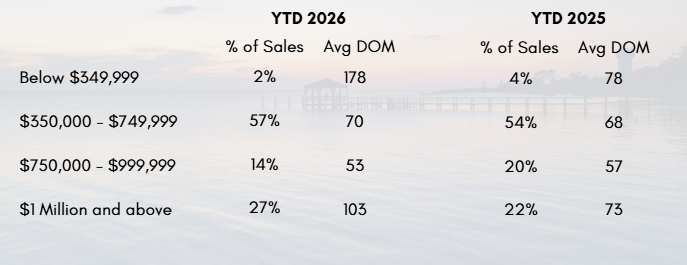
Year-over-Year Sales Comparison by Price Point
area data at-a-glance
*All market data presented is courtesy of the Outer Banks Association of REALTORS MLS Single Family Residential, Jan 1 - Dec 31 2025 and Jan 1 - Jan 31, 2026.