obx sandbar living monthly market update
Spring is winding down, summer is arriving, and with five months of 2026 now in the books, it's a great time to check in on where the market stands.
At first glance, the year-to-date numbers look surprisingly familiar. Sold units, median sales prices, and overall dollar volume are tracking relatively close to where they were at this point last year. But as is often the case in real estate, the headline numbers only tell part of the story.
When we dig a little deeper, some interesting trends begin to emerge—particularly in month-over-month activity, inventory movement, and the amount of time homes are spending on the market. These shifts may offer valuable clues about where the market is headed as we move into the heart of the summer season.
Whether you're thinking about buying, selling, investing, or simply keeping an eye on your home's value, this month's data provides plenty to talk about!
Let's take a closer look at what the numbers are telling us…and remember, if you’d like to dial in on some data specific to your neighborhood or home, feel free to contact me. 📈🏡
-Danielle
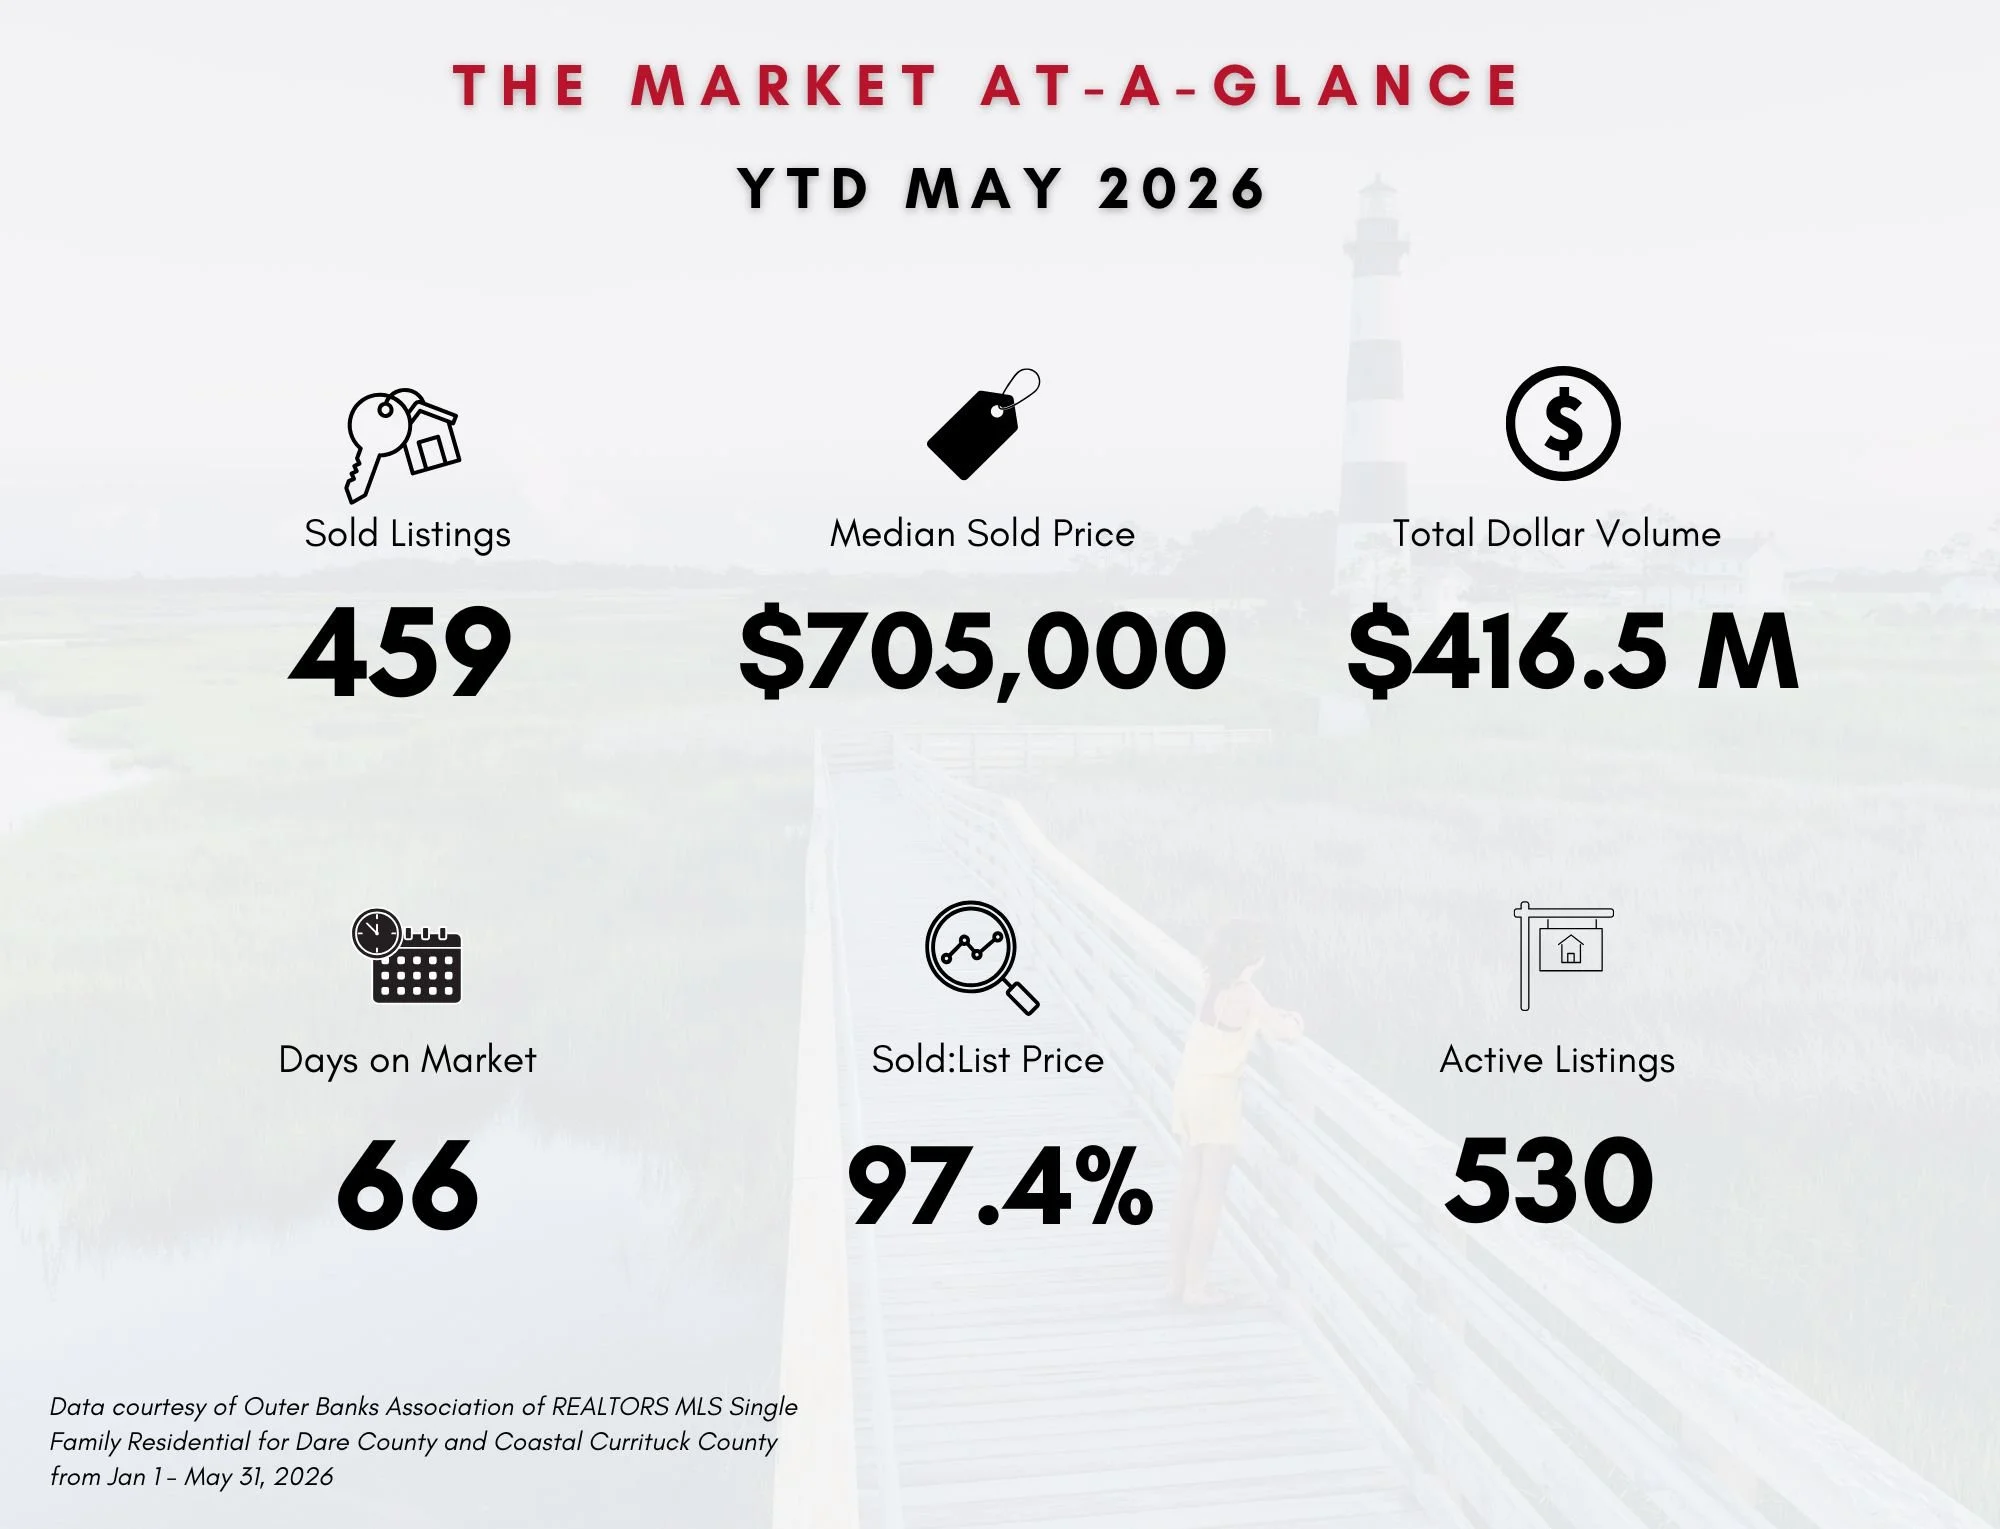
Outer Banks Real Estate Market-at-a-Glance for YTD 2026
Sold and Under Contract Analysis
SINGLE FAMILY RESIDENTIAL:
YTD residential sales units are down 3% versus YTD 2025
YTD residential sales dollars are up 2.8% vs. YTD 2025
YTD median sale price is $710,000, up 1% vs. YTD 2025 (meaning that half of the properties sold above $710,000 and half sold below that price)
YTD average sale price is $907,373, up 5.9% vs. YTD 2025
May 2026 residential sales units were up 8.9% versus May 2025
Sales units May ‘26 over April ‘26 were up 10.8%
New listing inventory for May was down 10.9% versus April
As a comparison, new listings for May‘26 were flat (down less than 1%) versus May ‘25
May residential sales volume vs. April was up 13.3%
Active listings are flat (down less than 1%) versus April
Multiple offer situations are down 3.9% year-over year, but up 35.7% May vs. April! You might recall that multiple offer situations were also up 43% in April versus March, so this is an interesting and seemingly persistent trend. While multiple offers are not a required disclosure in our MLS, they are heavily influenced by positioning in the market from the outset, as well as by area and town, so be sure to watch our monthly stats videos on YouTube for more insight!
As we’ve said before, it’s critical for sellers to price and position your home correctly from the outset. What does that mean? Follow the recent comparable sales and trends for your specific neighborhood and follow your trusted agent’s guidance on staging and making your home as attractive as possible to buyers. If you think selling is in your future, please don’t hesitate to contact me to discuss your options (and be sure to watch my latest seller video, Relevant vs. Irrelevant: What Actually Adds Value to your Home)!
For our buyers, keep in mind that if you’re waiting for a price reduction on your dream home, there’s a good chance that others are, too, and you might still wind up in multiple offers on a home that’s been on the market a while (it does happen and we experienced this phenomenon recently!). Now that multiple offer situations are on the uptick, it might be a good time to watch my video Multiple Offers in OBX? Don’t Panic!
Now, let's look at month-over-month:
Median sale price for all Residential property sold in the month of May was $743,400, flat (down less than 1%) versus April.
May 2026's median sale price was up 9.5% versus May 2025.
May ‘26 vs. May ‘25, residential properties sold 12.5% faster (year-over-year, they’re selling 12% faster than 2025).
We continue to see a reduction in cash buyers (down 2.4%) and disclosed multiple offers (down 3.9%) year over year (keep in mind that multiple offers are not a required disclosure in our MLS).
RESIDENTIAL LOTS AND LAND:
YTD residential land sales units down 15% versus YTD 2025.
YTD residential land sales dollars also down 17% versus YTD 2025.
YTD residential land median sold price is $150,000, flat versus YTD 2025.
May residential land sales units were down 29% compared to May 2025.
May residential land sales units were up 36% versus April.
May residential land sales dollars were down 33% versus May 2025.
May residential land sales dollars were down 7% versus April.
inventory analysis
New listing inventory for May 2026 was flat (down less than 1%) versus May 2025 and down 11% versus April’s new listings.
Drilling down, 163 new listings hit the market in May 2026, with 28.2% of those properties already sold or under contract.
Average days on market for these is 9; median days on market is 2 (the good stuff continues to move fast!).
6 of those listings has already closed as of 5/31; 2 of those were cash transactions, and none disclosed a multiple offer situation (as a reminder, disclosure of multiple offers is not required by our MLS).
See the chart below for the full breakdown by area…

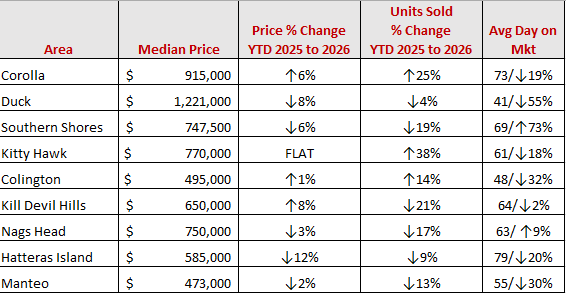
Inventory Analysis by Area YTD 2026
If you’d like to get more hyper-local with your neighborhood or area, please feel free to contact me!
days on market and distressed data analysis
Average days on market for SOLD residential properties in May was 63, selling 11.3% faster than April’s average of 71 days.
The average home sold 12.5% faster in May 2026 (63 days) versus May 2025 (72 days).
The Median days on market in May was 34, meaning that half of the sold units did so in 34 days or less.
Year over year, the average DOM for properties sold in 2026 is 66 (vs. 75 days YTD 2025), meaning that the average property sold 12% faster than one year ago.
Average days on market for all current ACTIVE residential listings is 101 days (flat versus April)
Month-over-month, the average days on market for Under Contract properties is 70 days (down 5.2% versus 73 days in April).
28.2% of properties listed in May have already gone under contract or sold with an average days on market of 9.
It still rings true that homes that are priced consistent with their condition and/or are located in high demand areas per the chart above are still moving quickly and with multiple offers.
For distressed sales (short sales and/or bank-owned properties), there were 0 sold units in May ‘26 (flat to May 2025). There were 2 active distressed units as of May 31, 2026.
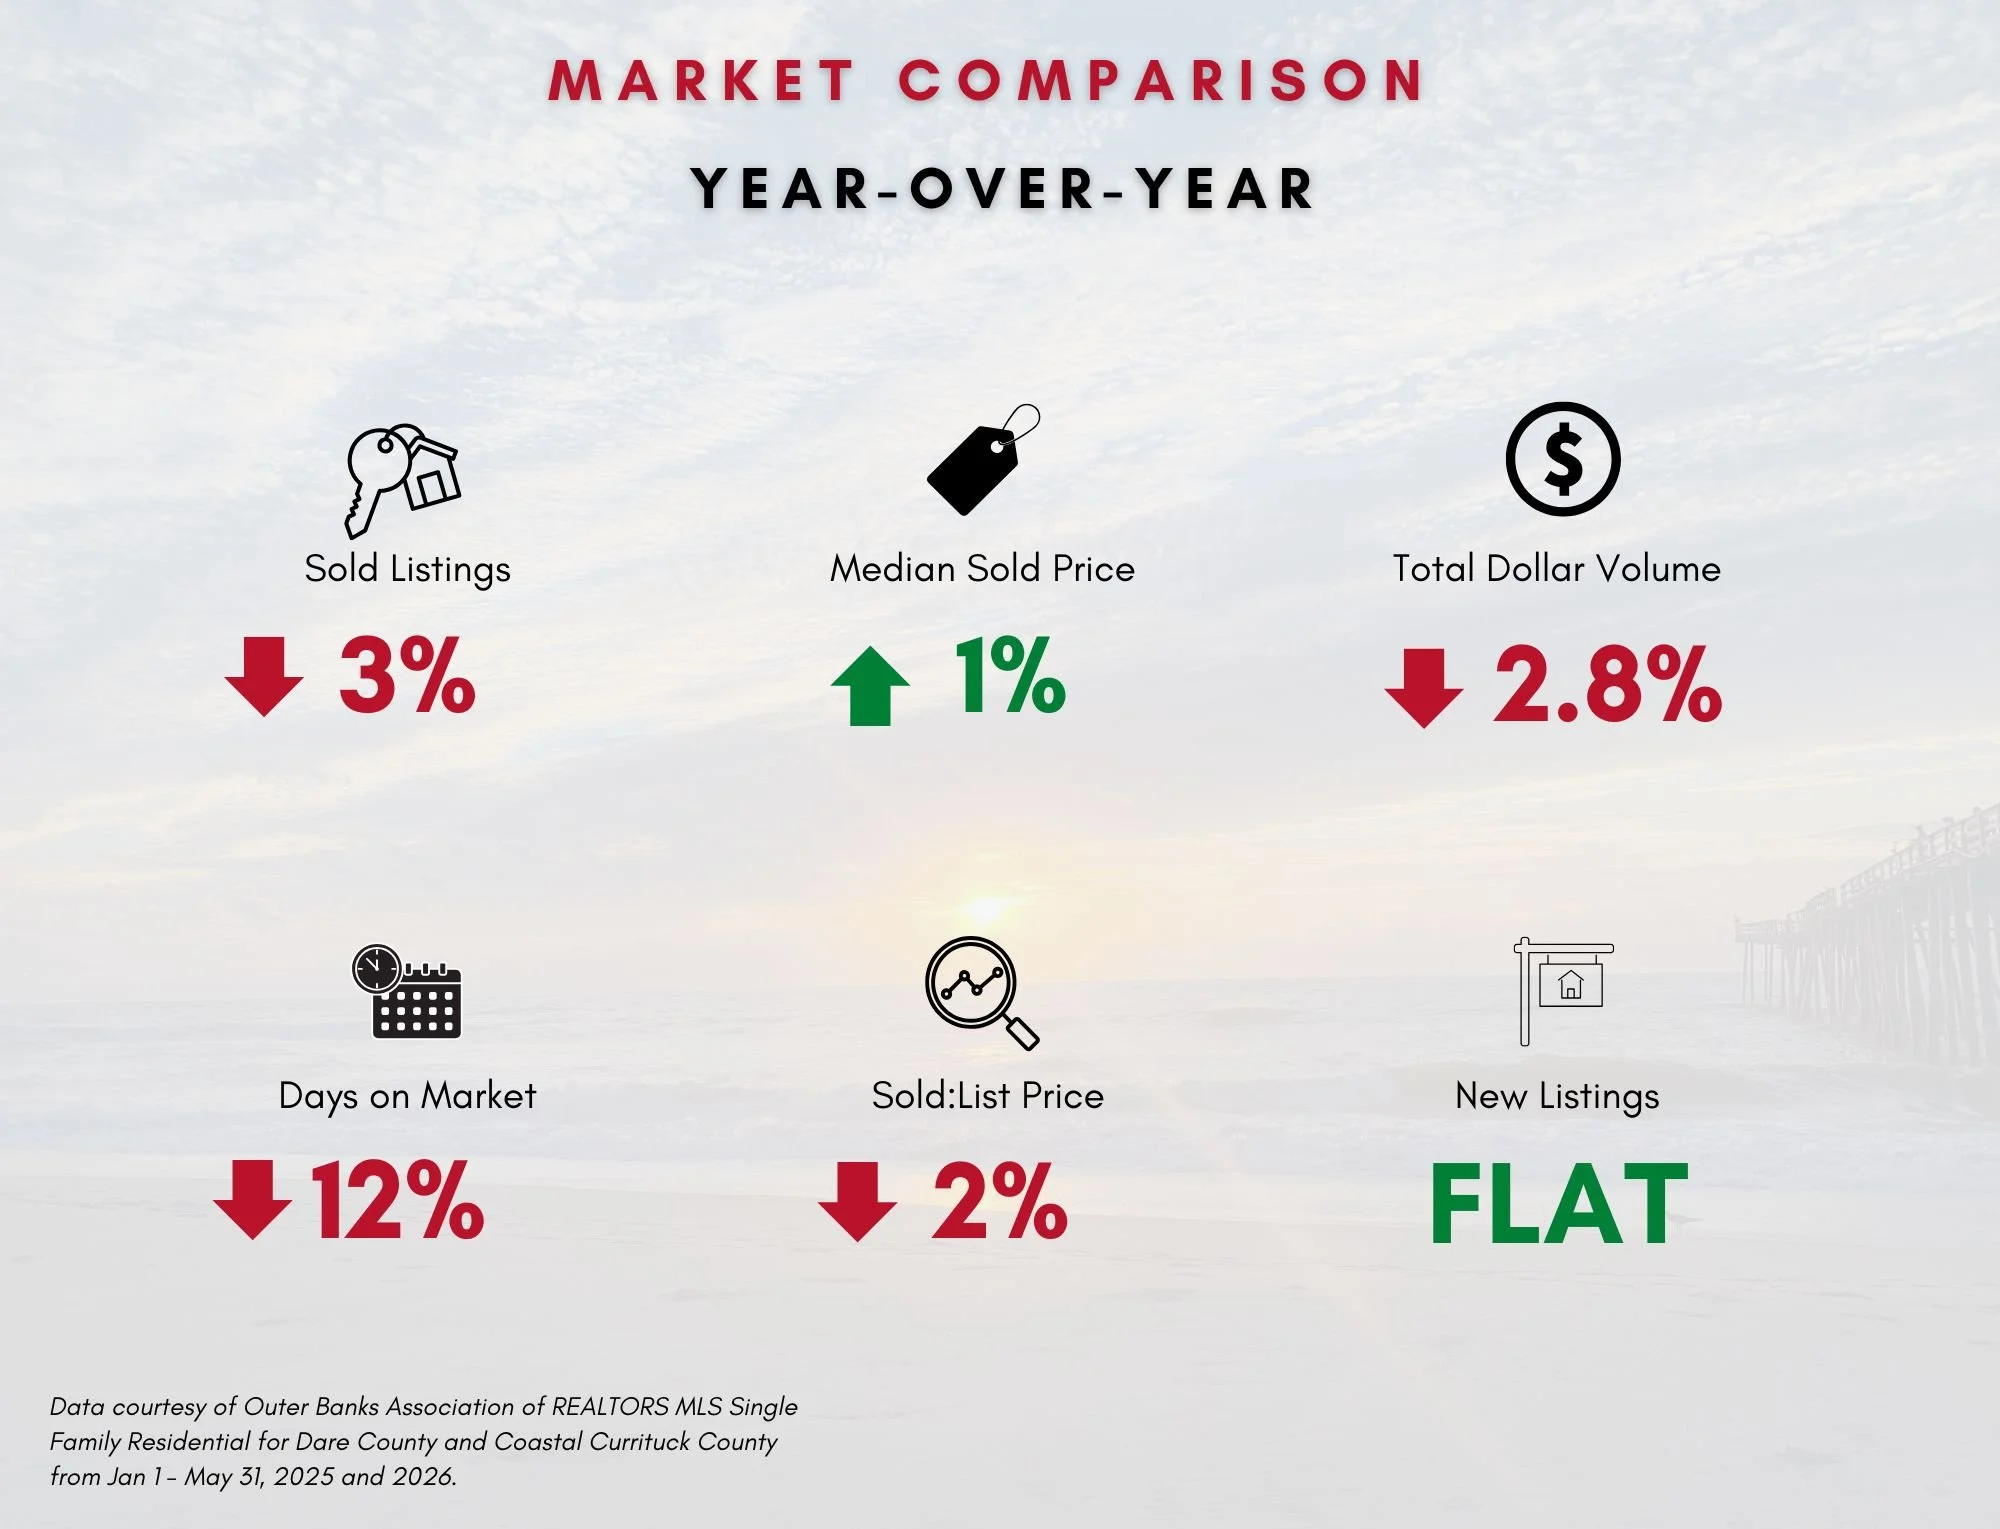
Year-Over-Year Market Comparison
pricing analysis
Residential Median Sale Price for YTD 2026 is $710,000, which is down 1% versus the year prior.
You’ll find a breakdown by price point below:
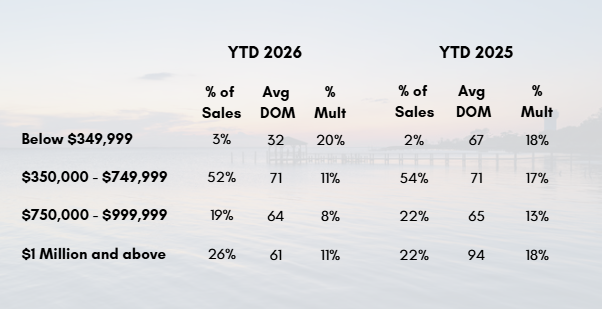
Year-over-Year Sales Comparison by Price Point
area data at-a-glance
*All market data presented is courtesy of the Outer Banks Association of REALTORS MLS Single Family Residential, Jan 1 - May 31, 2025 and 2026.